by mtmwood
by Fraser Davidson
by disneyanimation
by NONOTAKSTUDIO
<a href="http://www.vimeo.com/80008324">http://www.vimeo.com/80008324</a>by catweasel
<a href="http://www.vimeo.com/75616322">http://www.vimeo.com/75616322</a>by LEGS MEDIA
I genuinely enjoy studying on this website, it holds good content. Never fight an inanimate object. by P. J. O’Rourke. kkeagkgeebde
<a href="http://www.vimeo.com/76764603">http://www.vimeo.com/76764603</a>by Ryo Fujimoto
<a href="http://www.vimeo.com/77313221">http://www.vimeo.com/77313221</a>by Greg Little
<a href="http://www.vimeo.com/62869207">http://www.vimeo.com/62869207</a>by ECAL
<a href="http://www.vimeo.com/59197554">http://www.vimeo.com/59197554</a>by David Mórász
<a href="http://www.vimeo.com/75500464">http://www.vimeo.com/75500464</a>by Vitamins
<a href="http://www.vimeo.com/75120612">http://www.vimeo.com/75120612</a>by Chris Coleman
by The Creators Project
<a href="http://www.vimeo.com/42888813">http://www.vimeo.com/42888813</a>by TruedeNoizer
<a href="http://www.vimeo.com/74066522">http://www.vimeo.com/74066522</a>by df7383
<a href="http://www.vimeo.com/74130357">http://www.vimeo.com/74130357</a>by Susi Sie
<a href="http://www.vimeo.com/67809013">http://www.vimeo.com/67809013</a>by Marc-Antoine Locatelli
<a href="http://www.vimeo.com/36403894">http://www.vimeo.com/36403894</a>by Michael Burk
<a href="http://www.vimeo.com/62092214">http://www.vimeo.com/62092214</a>by Ilya Naishuller
<a href="http://www.vimeo.com/70573323">http://www.vimeo.com/70573323</a>by Michael Shainblum
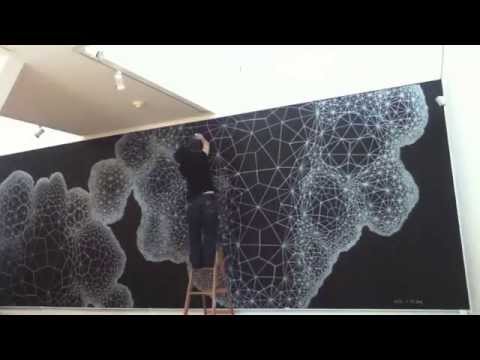
by Clint Fulkerson
by AssemblyTV
<a href="http://www.vimeo.com/72200086">http://www.vimeo.com/72200086</a>by NODE Forum for Digital Arts
<a href="http://www.vimeo.com/60170545">http://www.vimeo.com/60170545</a>by MILKYEYES – donato sansone
<a href="http://www.vimeo.com/35770492">http://www.vimeo.com/35770492</a>by Michael Langan
 by mtmwood
I genuinely enjoy studying on this website, it holds good content. Never fight an inanimate object. by P. J. O’Rourke. kkeagkgeebde