 ikeda = super again
Posts tagged ‘visualization’
 this absolute crazy mandel-world looks like people spent their lives modelling it.
but there is a tool for it.
a must see… definitely
comments:
 These charts show movie character interactions.
The horizontal axis is time.
The vertical grouping of the lines indicates which characters are together at a given time.
Eric Fischers Data Visualization is using geo-tagging tools (flickr and picasa API combined with pearl scripts) to contamine the positions of flickr-photos in 50 major cities. – great by technique and nice to look at
via flowingdata.com

Movie : Takuya Hosogane
Music : cubesato
BMS : sweez & Meine Meinung
Tools : AfterEffects, Cinema 4D
HQver : bonsajo.org/mov/vanishing_point.mov
… i r e a l l y love this one

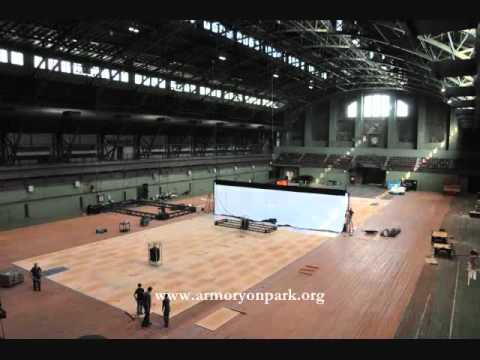
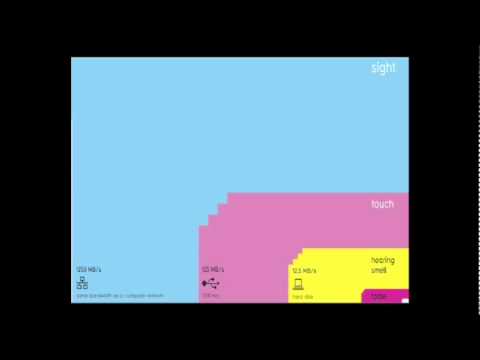
This is a short film by MAYA Design created to put some perspective on the
invisible but fast approaching challenges and opportunities in the pervasive computing age.

haha.. i was faster!
Hehe. i think we both read a certain shoutbox